NSB Science and Engineering Indicators Report of 2016
Heather Bloemhard Vanderbilt University
The National Science Board (NSB) is essentially the board of directors for the National Science Foundation. By law, NSB must report to the President and the Congress on "indicators of the state of science and engineering in the United States" in each even-numbered year. The Science and Engineering Indicators report (SEI) fulfills this requirement.
The press release, "U.S. Science and Technology Leadership Increasingly Challenged by Advances in Asia," has a top-level summary of the report.
The report presents data on 58 science and engineering indicators; this includes indicators that measure the performance and preparedness of K-12 students and teachers, the number of science, technology, engineering, and mathematics (STEM) degrees conferred, the size of the STEM workforce, the level of investment in research and development (R&D), and the level of return on that investment in R&D. The NSB SEI 2016 website allows you to delve into the report as much or as little as you'd like. I'll highlight some of the portions that have data specific to the physical sciences, and I encourage you to browse the website and report.
Chapter 1. Elementary and Secondary Mathematics and Science Education
- Presents data from the National Assessment of Education Progress mathematics and science tests that are administered to fourth, eighth, and twelfth graders.
- Looks at the qualifications/certifications of math and science teachers, their access to on-the-job training and continued education, and their working conditions.
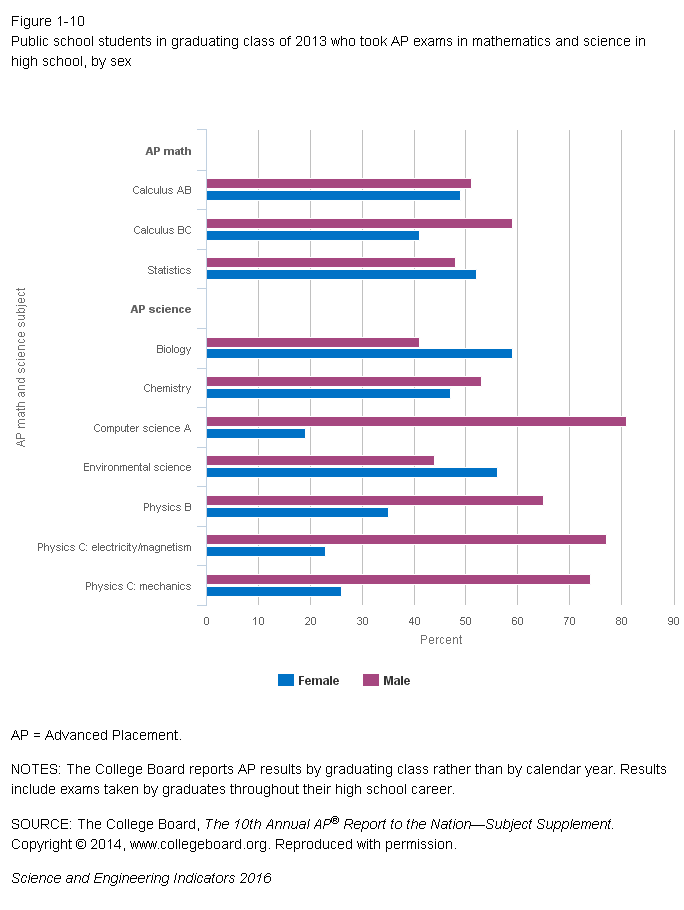
- In Figure 1-10, below, the percentage of students who took Advanced Placement (AP) exams in math and science, including Physics B & C, is presented.
Chapter 2. Higher Education in Science and Engineering
- Compares the main funding sources with the amount of money spent on instruction at institutions of higher education.
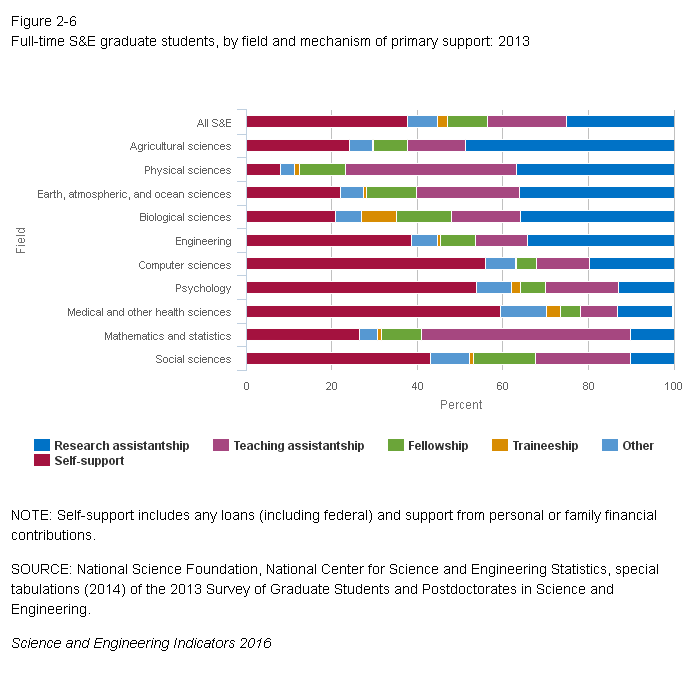
- Figure 2-6, below, compares the "mechanism of primary support" for graduate students in different fields.
- Figure 2-7 (not shown here) shows that approximately 27% of graduate students in the physical sciences are supported by the federal government.
- Figures 2-16 through 2-22 present the number and/or percentage of bachelor's, master's, and doctoral degrees conferred within science and engineering for different demographic groups.
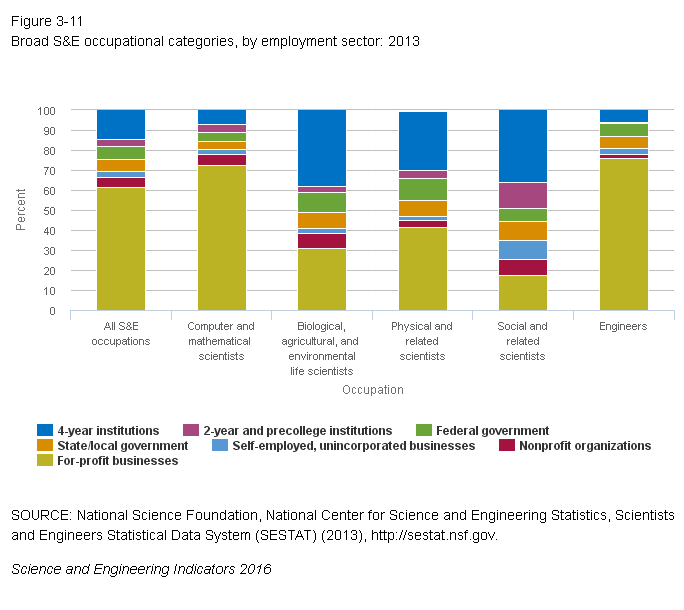
Chapter 3. Science and Engineering Labor Force
Chapter 4. Research and Development: National Trends and International Comparison
- Compares the level of investment in R&D across several sectors — business, the federal government, etc. — and with the world's other major economies.
- Figures 4-8 and 4-9 (not shown here) compare the dollars invested in R&D and the percentage of the GDP invested in R&D, respectively. When comparing dollars, the US leads in R&D investment, with the European Union and China coming in second and third. When comparing the percentage of GDP, South Korea, Japan, and Germany are ranked first, second, and third, respectively. The US has maintained its R&D funding percentage at 2.75% over the past several years, while South Korea and China have been increasing their percentage of investment.
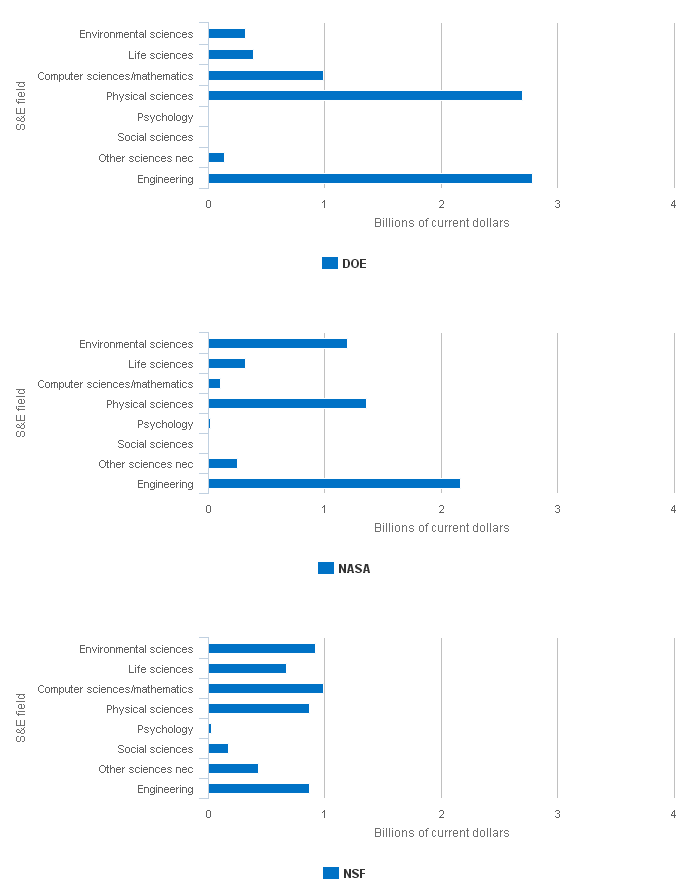
- Figure 4-13 breaks down the amount of funding by discipline for several agencies. I've included the DOE, NASA, and NSF portion of this figure.
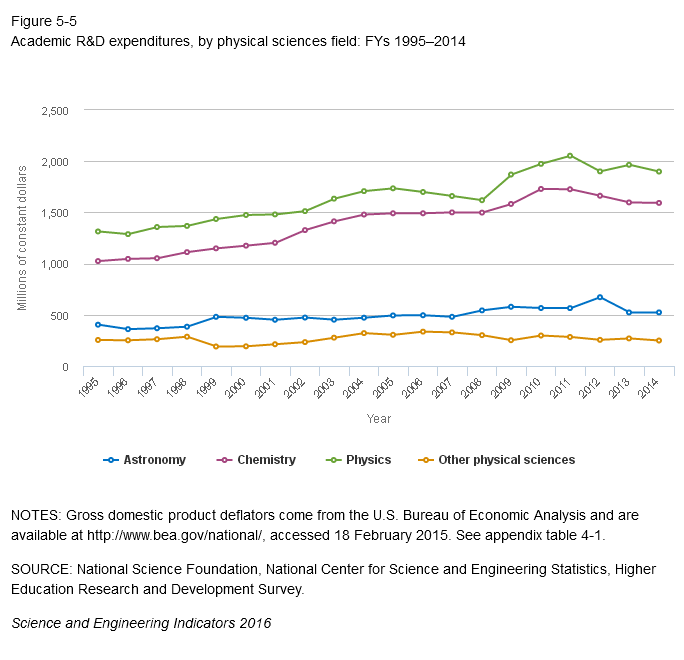
Chapter 5. Academic Research and Development
- Figure 5-1 (not shown here) compares the funding sources of R&D performed at academic institutions; the federal government funds nearly 60% of R&D.
- Figure 5-5, below, compares the amount of R&D funds spent by academic institutions in different physical-science fields.
- This chapter also considers "outputs," which are partly defined by the number and impact of publications and patents, and compares these outputs with the world's other economies.
Chapter 6. Industry, Technology, and the Global Marketplace
- This chapter presents data for knowledge & technology intensive (KTI) industries. This is a broad category that includes high-tech manufacturing, health care, and R&D.
Chapter 7. Science and Technology: Public Attitudes and Understanding
- This is a new chapter this year that presents data on the public response to questions like:
- Is it important for me to know about science in my daily life? (Figure 7-11)
- Do the benefits of science research outweigh any harmful results? (Figure 7-12)
- Is the world better off because of science and technology? (Figure 7-13)
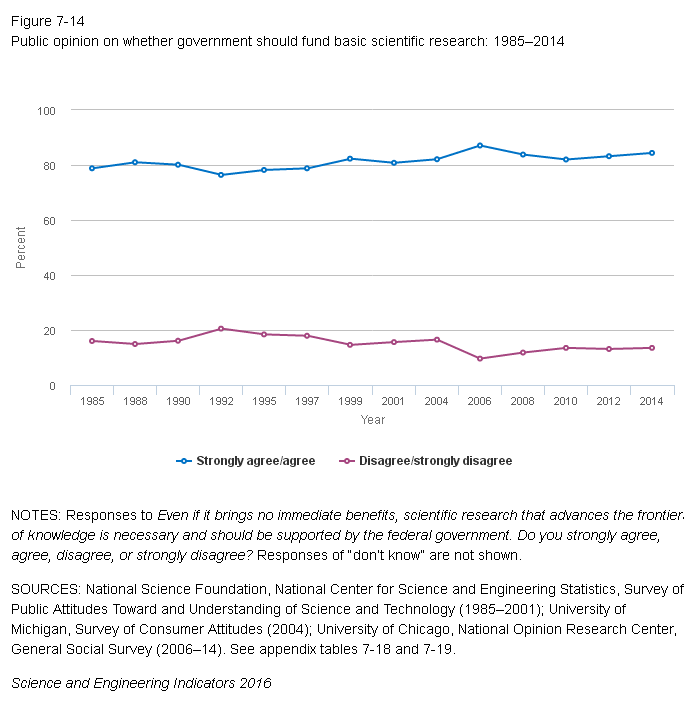
- Should the government fund basic science research, even if there are no immediate benefits? (Figure 7-14, below)
- Does the government spend too much, too little, or the right amount on scientific research? (Figure 7-15)